
10 Key Metrics to Analyze Your Email Campaigns
It’s easy to hit “send” and hope for the best, but real email marketing success comes from knowing what’s working and what’s not. That’s where tracking the right metrics makes all the difference. In this article, we’re breaking down 10 email metrics that every marketer should be watching and how each one helps you get better results.

#1. Open Rate
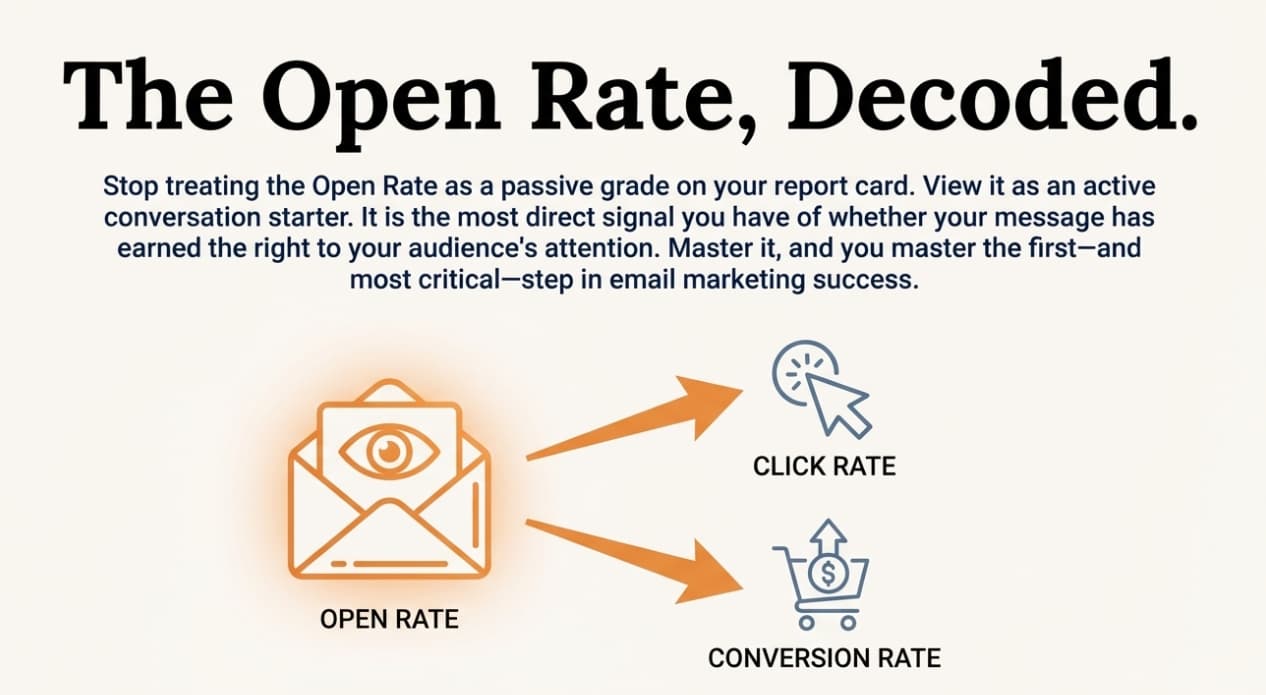
Open rate shows the percentage of recipients who opened your email, and it’s usually the first sign of how well your campaign is performing. While it doesn’t tell the full story, it gives you a sense of whether your subject line, preview text, and timing are working together to grab attention.
Example:
Let’s say you send a spring sale email to 10,000 subscribers, and 2,400 people open it. That’s a 24% open rate, which is pretty solid for most industries. But if last week’s email got a 36% open rate, it may be time to review your subject line or send time.
Pro Insight: Master your welcome series structure with our guide, ‘Best Welcome Email Examples: Psychology-backed engagement patterns,’ to understand why some campaigns sustain subscriber engagement while others experience drop-off.
Tip:
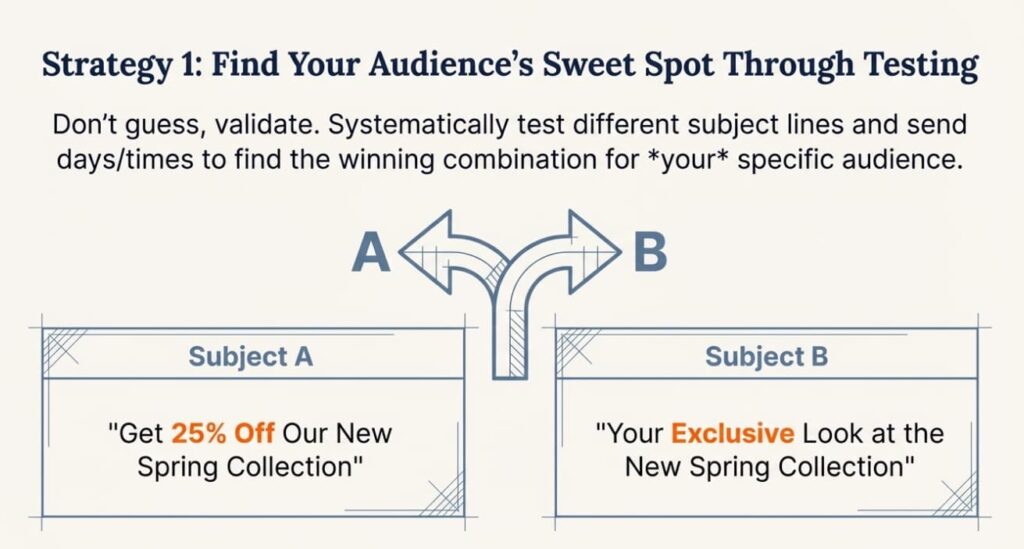
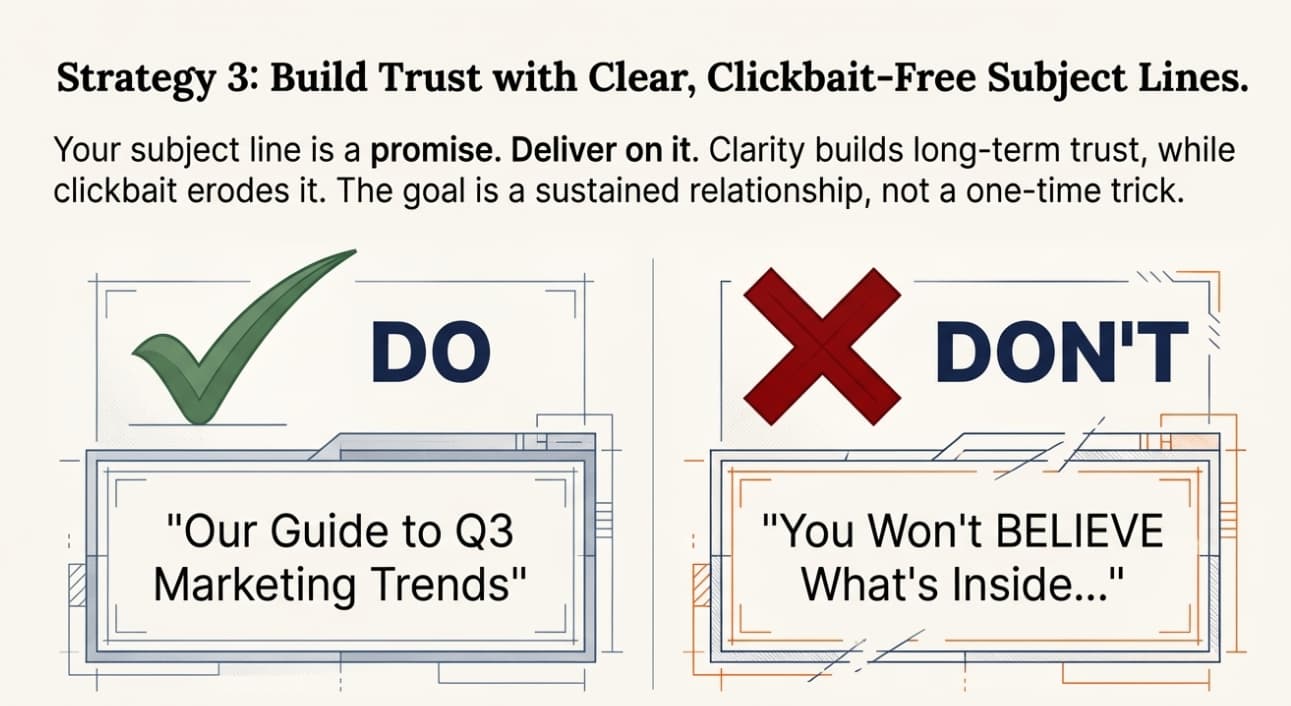
Test different subject lines and send days to find the sweet spot for your audience. Use personalization (like names or location references) to increase visibility. And always keep subject lines clear, with no clickbait.
Want to write subject lines that actually get opened? Master the art of compelling copy with these proven techniques: 9 Copywriting Tricks That Sell. Learn how to use curiosity, specificity, and value-driven messaging to boost your open rates consistently.
#2. Click-Through Rate (CTR)

CTR tells you how many people clicked a link in your email out of the total number of recipients. It’s a key measure of how compelling your offer and content are. If open rate shows interest, CTR shows action. The stronger your call-to-action and messaging, the higher your CTR tends to be.
Example:
You send an email to 5,000 people about a new product drop. Of those, 350 click the “Shop Now” button. That’s a 7% CTR, which is well above the average benchmark of 2–5%, and suggests your content and visuals are working.
Tip:
Stick to one primary call-to-action when possible, and make it clear and easy to find. Avoid cluttered designs or multiple messages that can dilute the purpose of your email.
Low CTR dragging down your results? The problem is often weak copy that doesn’t drive action. Use battle-tested structures that convert: 6 Copywriting Formulas for Email Marketing That Sell. These frameworks (like AIDA and PAS) give you plug-and-play blueprints for emails that get clicks.
#3. Conversion Rate
Conversion rate tells you how many people not only clicked your email but also completed the goal you wanted, like making a purchase, registering for a webinar, or downloading a guide. This is one of the most important metrics for measuring actual ROI because it shows who took action beyond just reading.
Example:
You send a promo offering 20% off all candles. Out of 500 people who click, 60 go on to complete a purchase. That 12% conversion rate shows your offer, landing page, and email all worked together to move people from interest to action.
Tip:
Make sure your email and landing page match in tone and content. If your email offers a discount, show that discount clearly on the page they land on. Remove friction from the buying process with clean design, fast load times, and clear instructions.
Struggling to turn clicks into customers? The issue might not be your individual emails—it’s often the lack of a cohesive journey. Build strategic sequences that guide subscribers from awareness to purchase: Build Email Customer Journeys That Convert. The right path can double or triple your conversion rates.
#4. Unsubscribe Rate
Unsubscribe rate shows the percentage of people who opted out of your email list after receiving a campaign. A few unsubscribes are normal and even healthy because it keeps your list clean. But if the rate jumps, it can signal that something in your message, frequency, or tone didn’t sit well.
Example:
You send an email that’s off-topic or too promotional, and suddenly your unsubscribe rate jumps to 1.8% when your usual is under 0.3%. That kind of spike is a clear sign that something didn’t land with your audience.
Tip:
Allow subscribers to adjust their email preferences so they can stay connected on their terms. Give them choices like fewer messages or content based on specific interests. Most importantly, focus on sending emails that offer real value, not ones that simply take up space in their inbox.
#5. Bounce Rate
Bounce rate measures how many of your emails fail to reach inboxes. Soft bounces are usually temporary issues, like a full mailbox, while hard bounces happen when an address is invalid or no longer exists. If bounce rates stay high over time, it can damage your sender reputation and affect deliverability.
Example:
You send an update to 3,000 subscribers, and 120 emails bounce. That’s a 4% bounce rate. If most are hard bounces, it may be time to clean your list or check your signup process.
Tip:
Use double opt-ins to help filter out fake addresses, and clean your list often to remove contacts that are no longer valid. A low bounce rate protects your sender reputation and keeps your emails landing where they should: in the inbox.
#6. Delivery Rate
The delivery rate measures how many of your emails actually reach subscribers’ inboxes, not just how many you send. A strong delivery rate means your list is healthy and your sending practices are solid. A dip could mean trouble with spam filters or list quality.
Example:
You send an email to 4,000 people, and 3,920 are delivered. That’s a 98% delivery rate, which is great. But if that number drops to 90% or below, it’s time to check your email list and sender reputation.
Tip:
Authenticate your domain (SPF, DKIM, and DMARC), avoid spammy words, and make sure your subscribers opted in. Regularly clean up inactive or outdated addresses to keep your list in good shape.
#7. Spam Complaint Rate
Spam complaint rate tracks how often recipients report your email as unwanted. Even a handful of complaints can impact your sender reputation and lead to future emails being filtered out or blocked. To stay in good standing with inbox providers, it’s best to keep this number below 0.1%.
Example:
You send a sale announcement to 10,000 contacts. If just 12 people report it as spam, that’s a 0.12% complaint rate, and is enough to raise concern with inbox providers.
Tip:
Be clear about who you are and why someone is getting your email. Avoid misleading subject lines, and make the unsubscribe link easy to find. If your content consistently meets expectations, people won’t feel the need to report it.
#8. Click-to-Open Rate (CTOR)
CTOR compares the number of people who clicked your email to the number who opened it. While CTR tells you overall engagement, CTOR shows how effective your content was once someone actually opened your message. It’s a great way to measure how your design, copy, and offer are working together.
Example:
You launch a teaser email for a new product, and 220 of the 1,000 people who open it click through to learn more. That’s a 22% CTOR, which signals that your content was engaging and the call-to-action hit the mark.
Tip:
Keep your email layout clean and focused. Use buttons or links that stand out and place your main call-to-action where it’s easy to find. Clear messaging and strong visuals can make a big difference in encouraging clicks once the email is opened.
Bonus tip: Understanding your target audience is crucial for high CTOR. The more relevant your content feels, the more likely people are to click. Learn how to deeply understand who you’re writing for: Target Market: Trends and Analytics for Email Campaigns in 2025.
#9. Revenue per Email (RPE)
Revenue per email (RPE) tells you how much money each email you send brings in. It’s one of the clearest ways to tie your email efforts directly to sales. High RPE shows that your messaging and targeting are converting. But when you have low RPE, it may be time to tweak your offer or audience.
Example:
You send a limited-time offer to 8,000 subscribers and generate $3,200 in sales. That’s $0.40 in revenue per email, and a solid return that justifies scaling the campaign.
Tip:
Track RPE alongside open, click, and conversion rates to understand the whole picture. Focus on segments that consistently deliver higher returns, and experiment with email timing, content, and offers to improve results.
#10. Engagement Over Time
Engagement over time reveals how your audience responds to emails across days, weeks, or even entire campaigns. It shows you when people lose interest, and when they’re most likely to act. This metric is especially helpful for planning send times, frequency, and re-engagement efforts.
Example:
Your welcome series sees great results on emails 1 and 2, but click rates drop sharply after email 3. That’s a cue to shorten the series or adjust the content flow.
Tip:
Look for patterns in drop-offs and strong responses. If subscribers engage less after three emails a week, dial it back to two. Use engagement trends to create better timing and pacing across your campaigns.
Make Your Metrics Work for You
Ultimately, you don’t need to track every number under the sun, but you do need to track the right ones. The 10 email marketing metrics we discussed today will give you the insights to improve what’s working and fix what’s not. Whether you want more clicks, better conversions, or stronger ROI, it all starts with understanding your data.
So take what you’ve learned and apply it consistently. Set clear benchmarks, run A/B tests, and let the data guide steady improvements with each campaign. When you understand what your numbers are telling you, it becomes easier to make decisions that lead to better results.
Just getting started with email marketing? These metrics matter most when you have a solid foundation. If you’re launching your first campaigns or need a refresher on the basics, start here: How to Start Your First Email Campaign.
If you’re ready to simplify how you track and improve your email campaigns, Nova Express can help you stay focused and move forward with confidence.
Maximize your email campaign ROI with Nova Express—track metrics and optimize effortlessly. Get started.
Essential Resources for Better Email Performance
Now that you know what to track, here’s how to improve each metric:
- 9 Copywriting Tricks That Sell
- 6 Copywriting Formulas for Email Marketing
- Build Email Customer Journeys That Convert
- Target Market: Trends and Analytics
Nova Express Resources
- What Is Nova Express?
- How to Start Your First Email Campaign: Step-by-Step Guide
- Amazon SES Integration Guide
- Mailgun Integration Guide
- Email Marketing Efficiency: Scale Smart
- What is Spam?
- NotebookLM for Marketers
- AI Tools for Marketers
- Nano Banana Pro: The Complete Guide for Marketers 2026
- 2026 Holiday Marketing Calendar
Start now: Nova Express
Frequently Asked Questions
What is a good open rate for an email campaign?
A good email open rate typically ranges from 15% to 25%, depending on the industry. Based on 2025 benchmarks:
- Nonprofit: 26.5%
- E-commerce: 18.7%
- SaaS: 31.0%
- Education: 24.3%
If your rate is below 15%, test your subject lines, sender name, or send time. Personalization (e.g., “Sarah, this one’s for you”) can boost opens by up to 26%. A/B testing and segmentation are proven ways to improve performance.
How do you calculate revenue per email (RPE)?
Revenue per email (RPE) is calculated as:
RPE = Total Sales ÷ Number of Delivered Emails
For example:
$3,600 in sales from 9,000 delivered emails
RPE = $0.40 per email
This metric ties email performance directly to revenue. Brands using targeted messaging and behavioral triggers often see RPE of $0.80 or higher. Tracking RPE helps you understand which campaigns truly move the needle, not just in clicks, but in profit.
Updated in 2026 to reflect the latest strategies and data.

About the author
Serafima Osovitny is a marketing manager at Nova Express. Passionate about turning complex marketing tactics into simple, actionable guides, she shares insights about email marketing and e-commerce. Follow her on Twitter: @OSerafimaA.


Perfectly written written content, regards for information .
A great reference for anyone tired of staring at reports and not knowing what to do with them. After reading this article, the numbers finally start to feel manageable instead of chaotic.
Clear explanations and practical examples made it easy to spot where my campaigns can be improved.
Clear, well-structured, and genuinely useful. The article breaks down email metrics in a way that’s easy to understand and apply, with practical examples that make the numbers feel real. After reading it, you know exactly what to track, why it matters, and what to fix first.
When you’re just starting out, figuring out what matters after hitting ‘send’ can be really confusing. This guide finally gave me a clear, 10-step roadmap. What’s best is that for every metric, it goes beyond the definition to give a real-world example and practical tips for when your results aren’t great.
This article finally made email metrics feel simple, now I actually understand what to track and how each number helps improve real results.